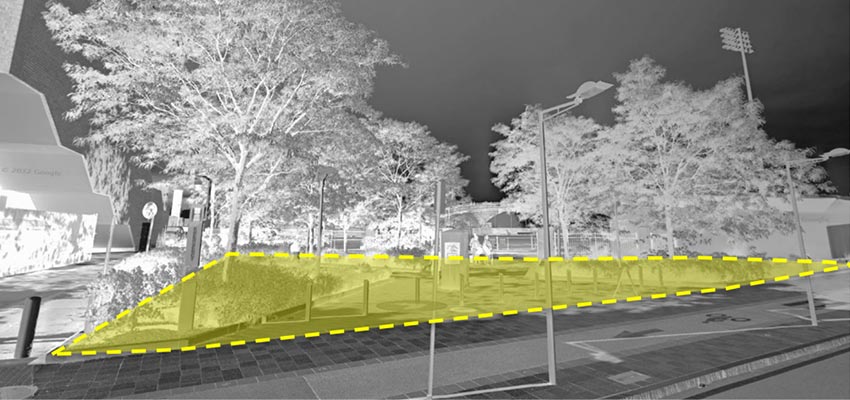
Developing a platform which simulates the benefits of using heat pumps and other renewable HVAC technologies using real building data on current energy usage, in order to facilitate communication. In particular, we hope the results of this project will convince the Massachusetts Institute of Technology (MIT) to adopt heat pumps in its Central Utilities Plant (CUP).
MIT D-Lab Class
D-Lab: Water, Climate Change, and Health
Community partners
- Professor Amro Farid, Stevens Institute of Technology, Professor and Alexander Crombie Humphreys Chair Professor in Economics of Engineering.
- Rick Clemenzi, Advanced Heat Pump specialist. Principal of Geothermal Design Center, Licensed HVAC Contractor.
- Judy Siglin, director Net Zero Foundation
Location
Cambridge, Massachusetts (US)
Student team
MIT students unless otherwise noted.
- Alex Greene, PhD, Physics ‘23: Alex Greene just completed her PhD in Quantum Computing. She will begin working at Google in Santa Barbara shortly.
- Vivian Cheng, '23, Civil & Environmental Engineering: Vivian Cheng: Systems engineering student interested in the intersection of computation and sustainability, especially in transportation and international development.
- Viviana Urra, '23, MDes Energy and Environment, Harvard Graduate School of Design: Viviana Urra, Architect from Chile with strong interest in climate change mitigation, energy efficiency and building performance.
At least one captioned landscape-oriented image (preferably 850 x 400 pixels, 72p/i resolution) and up to 5 additional captioned images. Images should be emailed as attachments or a link to a folder.
Intern
Udita Bajaj, D-Lab Data Science Intern, 2022-2023,. Udita Bajaj: Data Science and Political Science Wellesley graduate (’22) student in D-Lab: Water, Climate Change and Health.
Problem framing
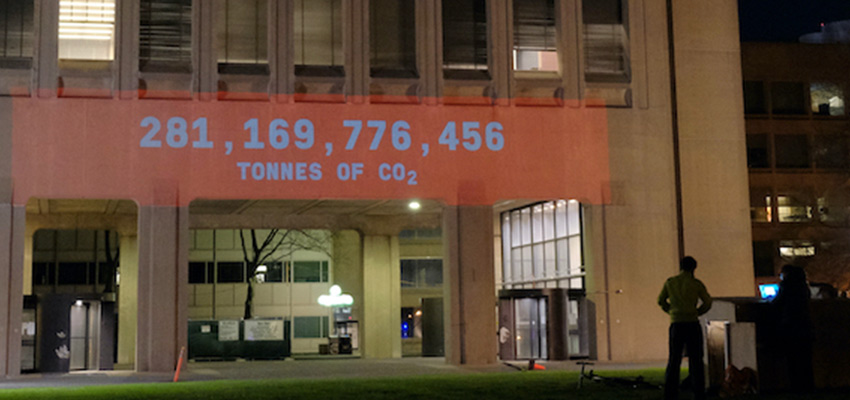
In MIT’s 2021 Climate Action Plan, the institute set goals of achieving net-zero carbon emissions by 2026 and eliminating direct carbon emissions entirely by 2050. Given that campus building operations are associated with 97% of MIT’s greenhouse gas emissions, building decarbonization is vital to achieving these goals.
Cultural and/or market context
This is a transitional and transformational time in the field of heating, ventilation, and air conditioning (HVAC). New advances in technologies and techniques, especially surrounding heat pumps, have made net-zero energy and carbon buildings a reality. However, the widespread adoption of these techniques is limited by a lack of communication of its benefits and financing opportunities.
Competitive analysis
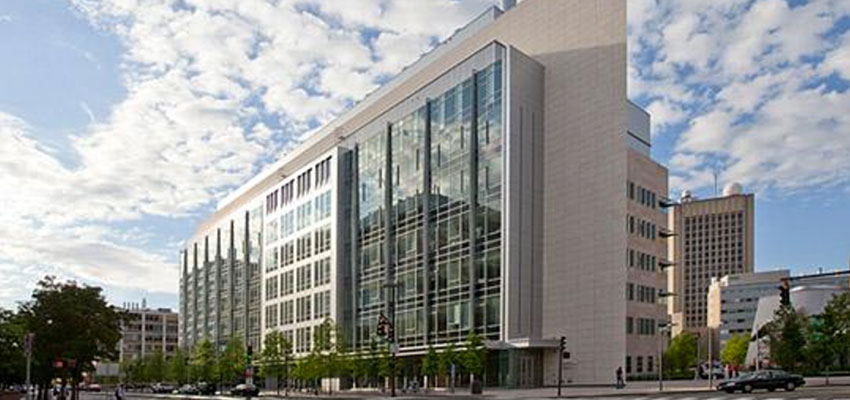
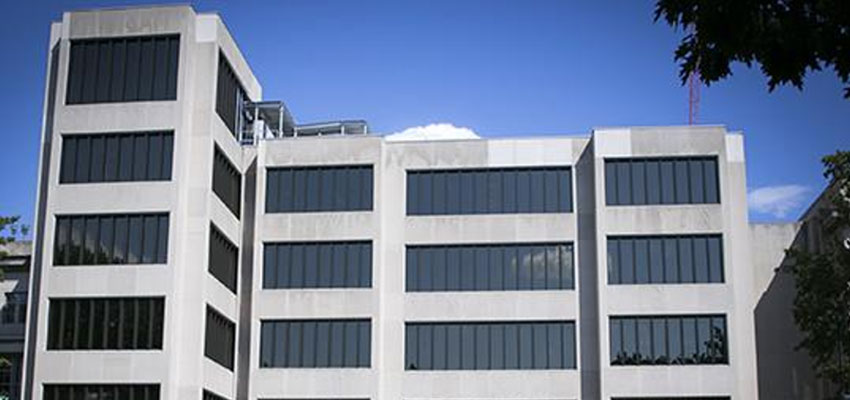
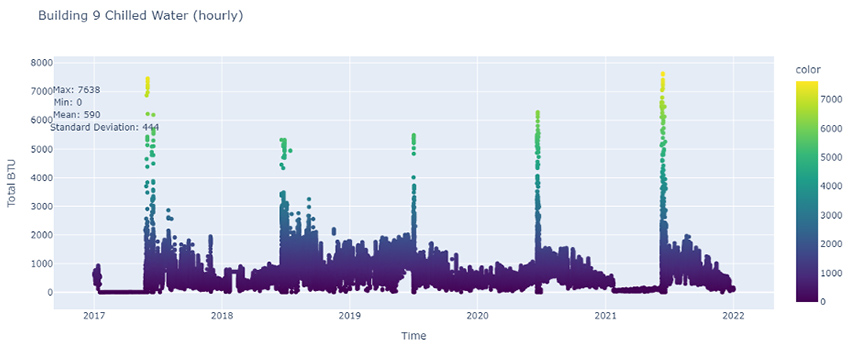
Using data gathered from energy meters in MIT buildings 76 and 9, we are using data analysis and data visualization for information on power usage, chilled water and steam from 2017 to 2022 to model historical energy usage patterns and draw insights on how these buildings can improve in their performance.
Solution including technical details
Combining historical building energy consumption data with local weather data, exploratory analysis and segmented regression models were run using python. We found that wet bulb temperature captures the variation in hourly steam and chilled water usage best in comparison to other weather factors. Also, we observed that intense weather events and disruptions like the pandemic are reflected in the buildings’ energy usage patterns.
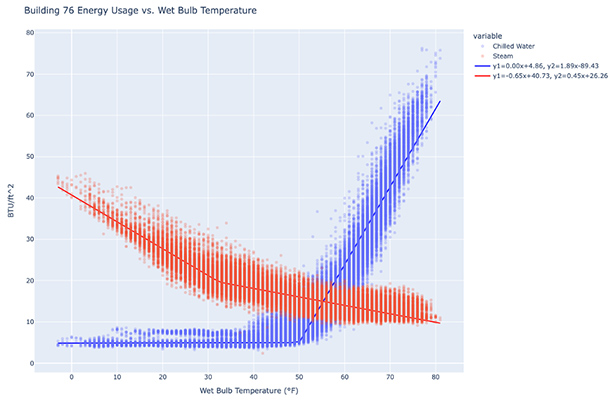
The regression analysis for Building 76 chilled water and steam usage in relation to wet bulb temperature.
Hand-off to partner, next steps
This project can have two different branches:
- To do a historical analysis related to building usage, building remodeling history and community behavior to improve on the uncertainty of certain gathered data and find more correlations with the building performances
- Create a platform to show this information to the MIT community and generate consciousness on operational carbon from MIT campus.
Contact
Susan Murcott, D-Lab: Water, Climate Change, and Health Instructor
Julie Simpson, D-Lab: Water, Climate Change, and Health Instructor