MIT D-Lab class
D-Lab: Climate Change and Planetary Health (EC.719/EC.789) Spring 2025
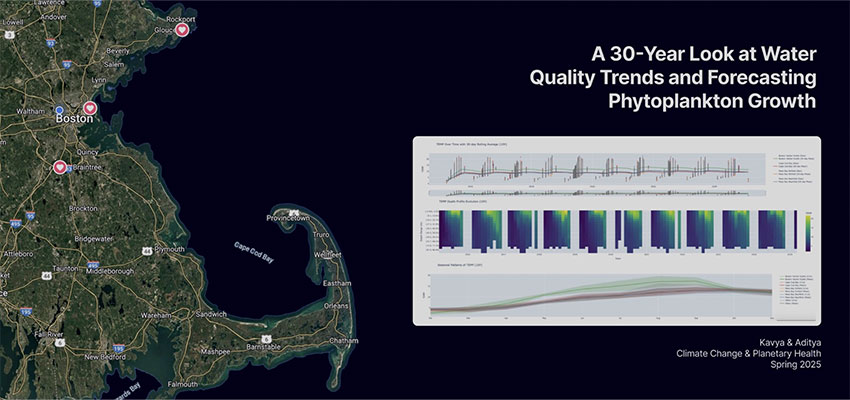
Visualizing Decades of Water Quality Data to Inform Climate Resilience in Massachusetts Bay
Team
- Aditya Agarwal – Master in Design Engineering (Harvard University): Aditya is a computational designer and strategist with a background in architecture and UX design, currently exploring the intersection of AI and environmental systems at Harvard.
- Kavya Anbarasu – Undergraduate Senior (Massachusetts Institute of Technology): Kavya is an MIT senior majoring in environmental engineering and computer science, with a passion for applying machine learning to ecological problems.
Community partner
Massachusetts Water Resources Authority (MWRA)
Individuals worked with: MWRA Environmental Quality Department Website:
Country
United States
Problem framing
Massachusetts Bay, a vital ecological and economic resource, has experienced significant shifts due to urban development, climate change, and policy interventions. While the MWRA has collected extensive water quality data for over three decades, the sheer volume and technical complexity of the data have limited its accessibility and real-time use in environmental planning and response.
Cultural and institutional context
MWRA’s mandate to safeguard Boston’s marine ecosystem stems from historical challenges around pollution and wastewater management. Its long-term dataset offers a rare opportunity to trace environmental progress and anticipate future risks. Our collaboration builds on this legacy by providing tools that translate complex scientific records into intuitive, actionable formats.
Theory of change
We believe that empowering environmental professionals and decision-makers with visual tools and predictive models can drive proactive stewardship of coastal ecosystems. By making
long-term data more interactive and interpretable, we aim to facilitate quicker recognition of trends, risks, and opportunities.
Solution overview
Our solution is a web-based application that brings to life 30 years of water quality data using interactive charts, geospatial maps, and predictive analytics. Built using Python, JavaScript, and open-source libraries, the tool supports:
- Year-to-year comparison of pollutants such as nitrogen, phosphorus, and chlorophyll-a
- Forecasting of phytoplankton biomass using seasonal trends and supervised machine learning
- Dynamic visual summaries of spatial and temporal variation across monitoring sites
Next steps
We are currently working with MWRA to determine the most effective way to integrate this tool into their workflows. Plans for long-term maintenance, public access, and feature expansion are still under discussion. Final decisions will be made in collaboration with MWRA staff in the coming weeks.
Contact
Aditya Agarwal, student team member
Kavya Anbarasu, student team member